Power BI Dashboard For Dental Clinic in UK

Background
A private dental clinic in UK is known for its patient-centered care, recognized the need to improve its operational efficiency and data-driven decision-making. Using Dentally as their CRM, they partnered with us to design and implement customized Power BI dashboards that would provide real-time insights into key performance metrics.

Objective
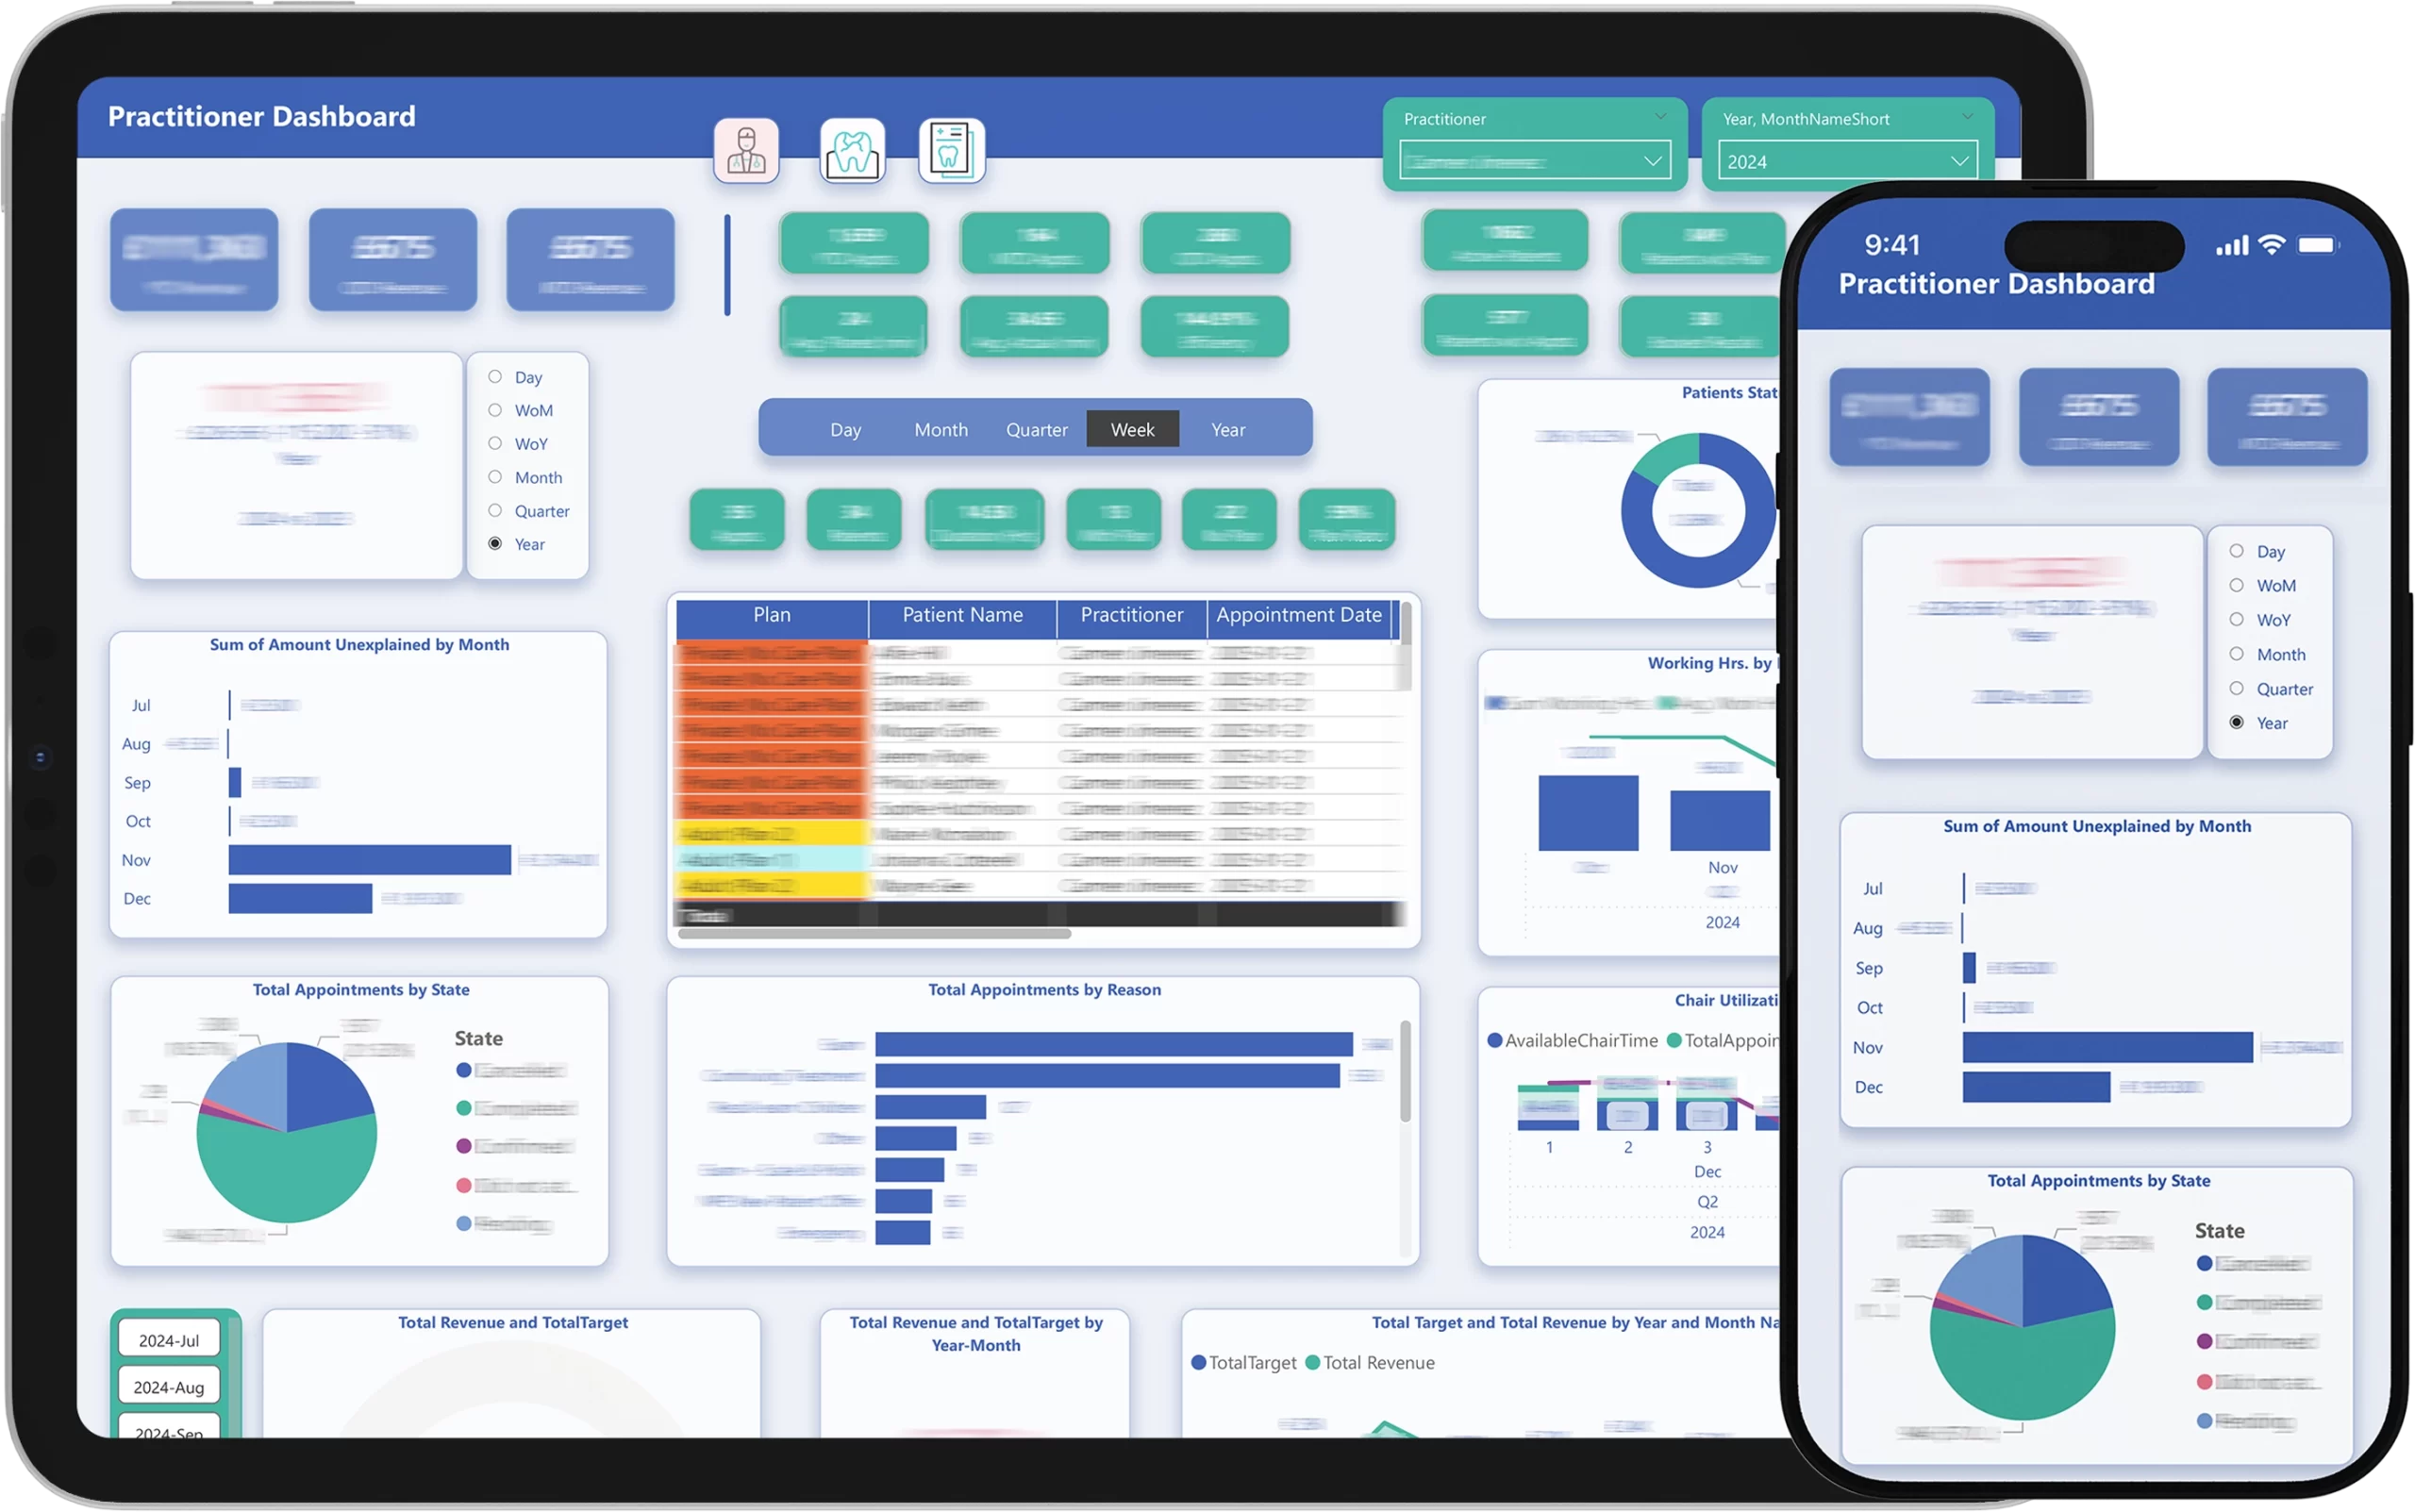
- Create visually engaging dashboards with a dental-themed design to resonate with the clinic's identity.
- Provide tools to track revenue forecasting and practitioner performance.
- Improve operational insights, including appointment efficiency and patient management.
Solutions Delivered
01 Revenue Forecasting
Revenue Summary Dashboard:
- A visually engaging summary screen showcasing Month-to-Date (MTD), Quarter-to-Date (QTD), and Year-to-Date (YTD) revenue metrics.
- Rolling forecasts integrated with practitioner-specific targets, color-coded to indicate progress.
Revenue Trends:
- Comparative analysis of revenue across months, weeks, and years.
- Interactive cards and visuals that make it easy to spot trends and deviations.
Practitioner Performance Metrics:
- Dashboards displaying individual practitioner targets and achievements.
- Metrics derived from UDA and UOA target fields in Dentally’s database.
02 Operational Efficiency
Chair Utilization:
- A utilization percentage metric with interactive visuals to monitor chair usage.
- Enhanced logic to align with Dentally’s internal metrics for reliability.
Appointment Efficiency:
- Visuals measuring the efficiency of appointments, highlighting under or over-completion times.
- Interactive tools to identify bottlenecks in scheduling.
Late Appointment Insights:
- Measures to track late appointment starts and durations, enabling better time management.
03 Patient Management
Active Patient Metrics:
- Real-time counts of active patients displayed on the dashboard.
- Pie charts illustrating the ratio of active to non-active patients.
Recall and Unbooked Treatments:
- Metrics showing the percentage of patients booked for their next recall.
- Visuals highlighting unbooked treatments for actionable follow-ups.
Care Plan Analysis:
- Metrics showing the number and percentage of patients enrolled in care plans.
- Donut charts offering an intuitive representation of these metrics.
Aftercare and Forms Compliance:
- Planned integration of metrics to measure compliance with aftercare forms.
Revenue Forecasting and Practitioner Performance:
- Revenue Summary Dashboard:
- A visually engaging summary screen showcasing Month-to-Date (MTD), Quarter-to-Date (QTD), and Year-to-Date (YTD) revenue metrics.
- Rolling forecasts integrated with practitioner-specific targets, color-coded to indicate progress.
- Revenue Trends:
- Comparative analysis of revenue across months, weeks, and years.
- Interactive cards and visuals that make it easy to spot trends and deviations.
- Practitioner Performance Metrics:
- Dashboards displaying individual practitioner targets and achievements.
- Metrics derived from UDA and UOA target fields in Dentally’s database.
Operational Efficiency:
- Chair Utilization:
- A utilization percentage metric with interactive visuals to monitor chair usage.
- Enhanced logic to align with Dentally’s internal metrics for reliability.
- Appointment Efficiency:
- Visuals measuring the efficiency of appointments, highlighting under or over-completion times.
- Interactive tools to identify bottlenecks in scheduling.
- Late Appointment Insights:
- Measures to track late appointment starts and durations, enabling better time management.
Patient Management:
- Active Patient Metrics:
- Real-time counts of active patients displayed on the dashboard.
- Pie charts illustrating the ratio of active to non-active patients.
- Recall and Unbooked Treatments:
- Metrics showing the percentage of patients booked for their next recall.
- Visuals highlighting unbooked treatments for actionable follow-ups.
- Care Plan Analysis:
- Metrics showing the number and percentage of patients enrolled in care plans.
- Donut charts offering an intuitive representation of these metrics.
- Aftercare and Forms Compliance:
- Planned integration of metrics to measure compliance with aftercare forms.
RESULTS
The Power BI dashboards have revolutionized how Dental Clinic operates, delivering:
- Enhanced Visibility: Real-time insights empower management to make informed decisions quickly.
- Improved Practitioner Performance: Practitioners are motivated by clear, visual targets and performance metrics.
- Streamlined Operations: Detailed insights into patient management and appointment efficiency reduce inefficiencies and improve care delivery.
Design Highlights:
- The dashboards incorporate a dental-themed color palette and icons, ensuring an engaging and on-brand experience.
- Interactive visuals and charts provide a user-friendly interface for exploring data.
Conclusion
Our work with Private Dental in UK showcases the transformative power of tailored Power BI solutions in the healthcare sector. By integrating BI performance services with a design that reflects the clinic’s identity, we delivered a solution that drives both operational efficiency and practitioner engagement. The result is a data-driven practice ready to meet its growth objectives.